Financial Highlights
Financial Highlights
millions of yen
FY2018 (IFRS) |
FY2019 (IFRS) |
FY2020 (IFRS) |
FY2021 (IFRS) |
FY2022 (IFRS) |
FY2023 (IFRS) |
|
|---|---|---|---|---|---|---|
| Net sales | 367,960 | 333,371 | 297,177 | 335,138 | 426,684 | 435,081 |
| Operating income | 145,081 | 130,628 | 117,438 | 110,312 | 149,003 | 153,310 |
| EBITDA | ー | ー | ー | ー | 175,649 | 188,745 |
| Profit attributable to owners of parent | 137,191 | 122,193 | 111,858 | 114,185 | 184,965 | 162,030 |
Performance in fiscal 2023
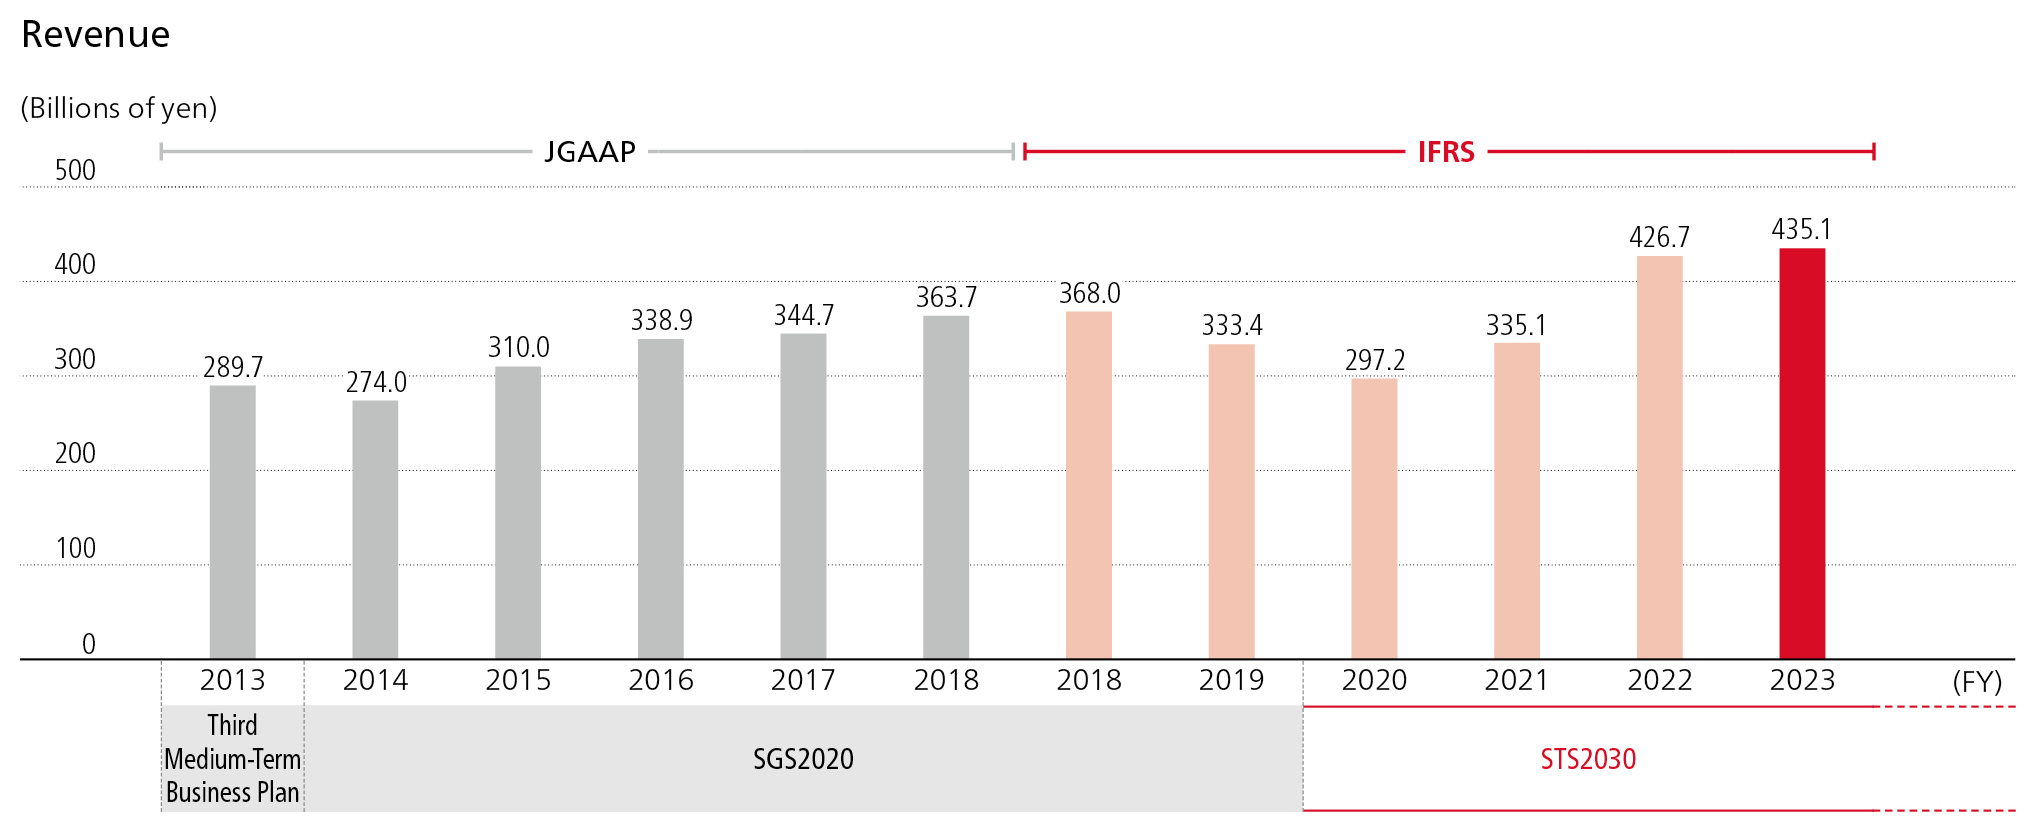
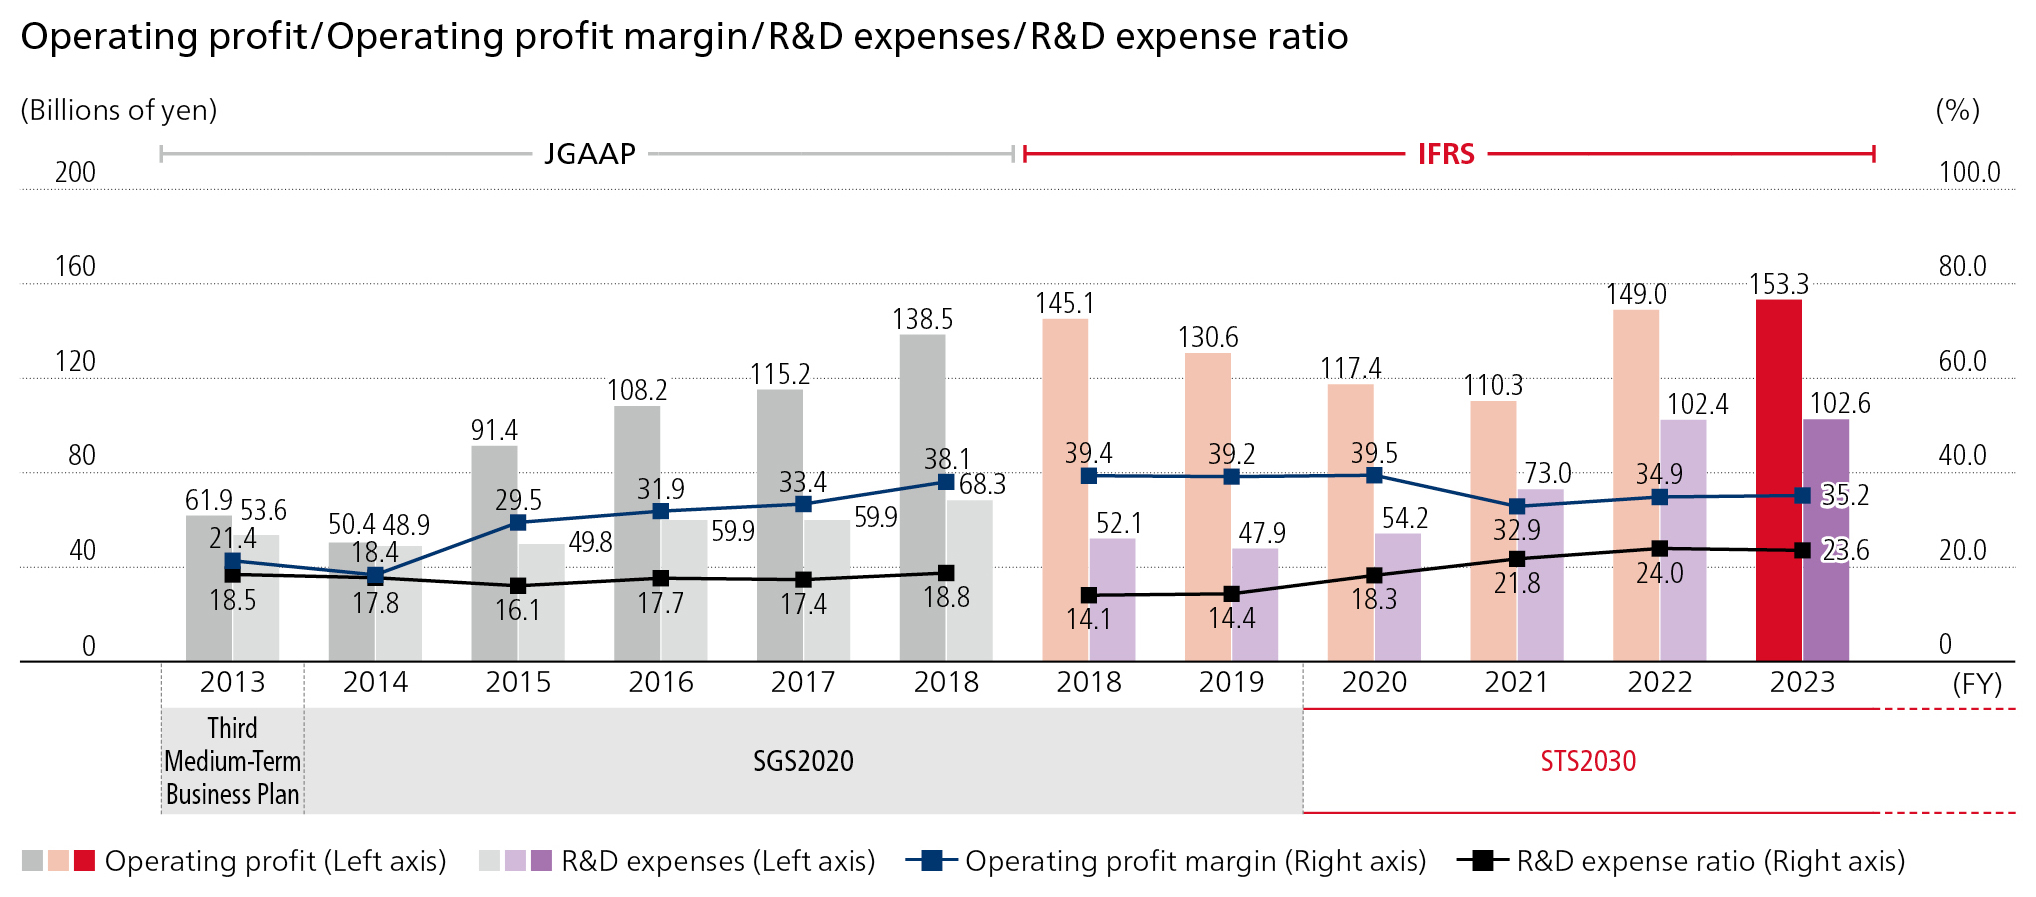
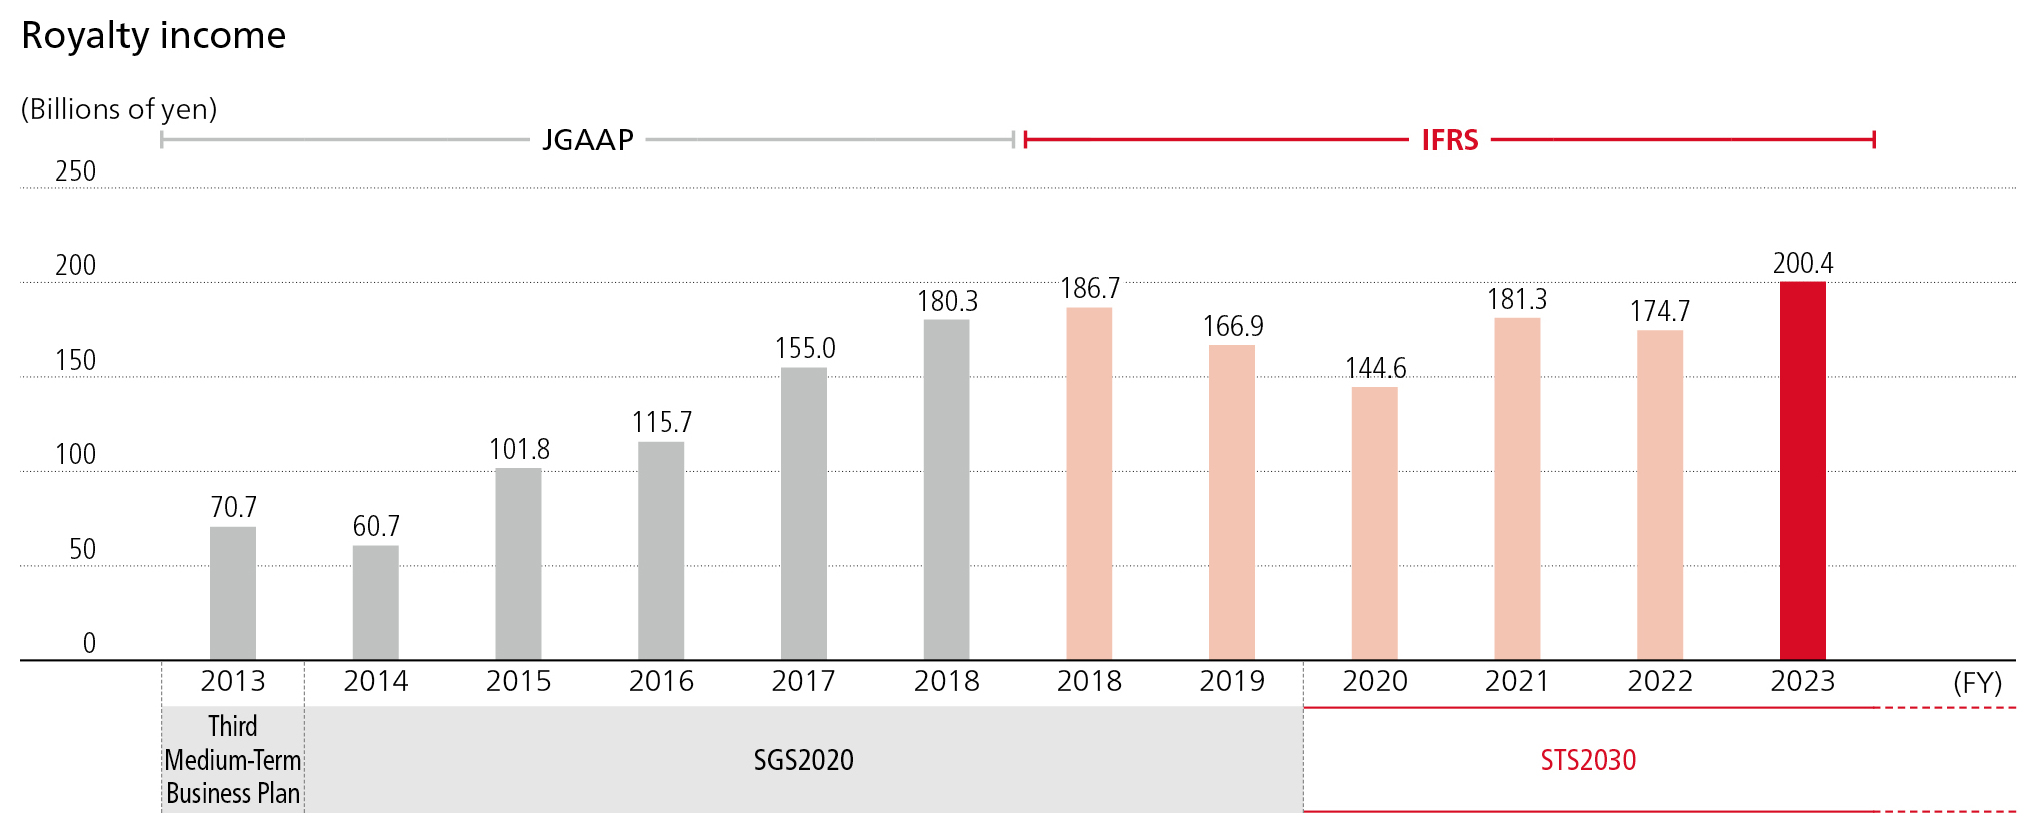
Shionogi has adopted International Financial Reporting Standards (IFRS) from the fiscal year ended March 31, 2020. The financial figures are shown for both JGAAP and IFRS for the fiscal year ended March 31, 2019.
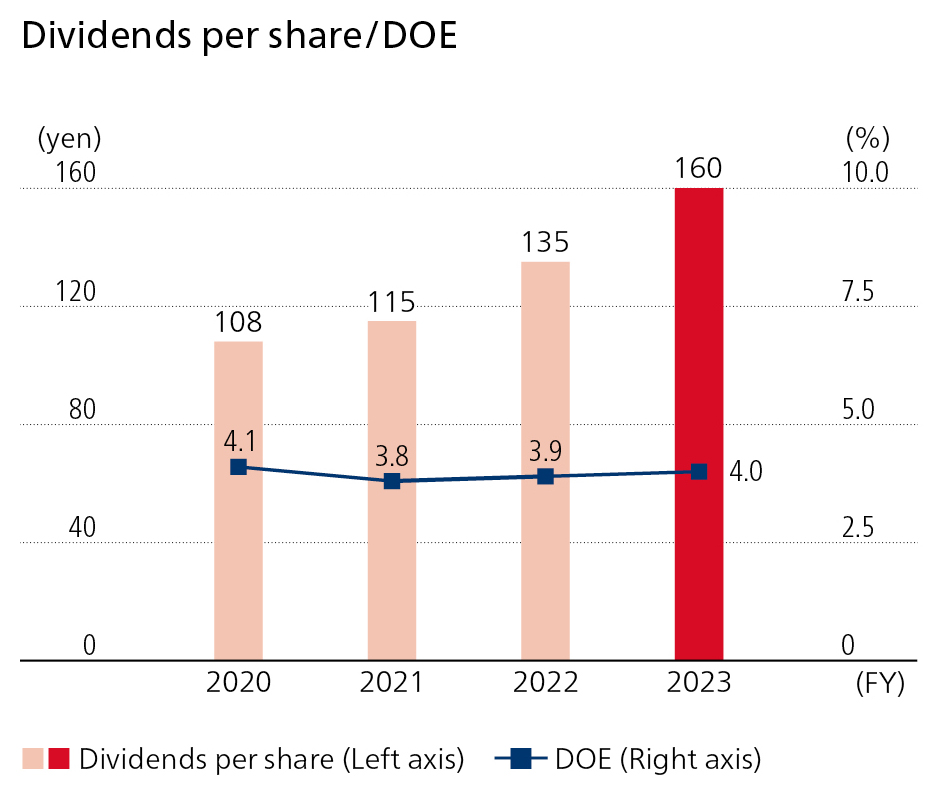
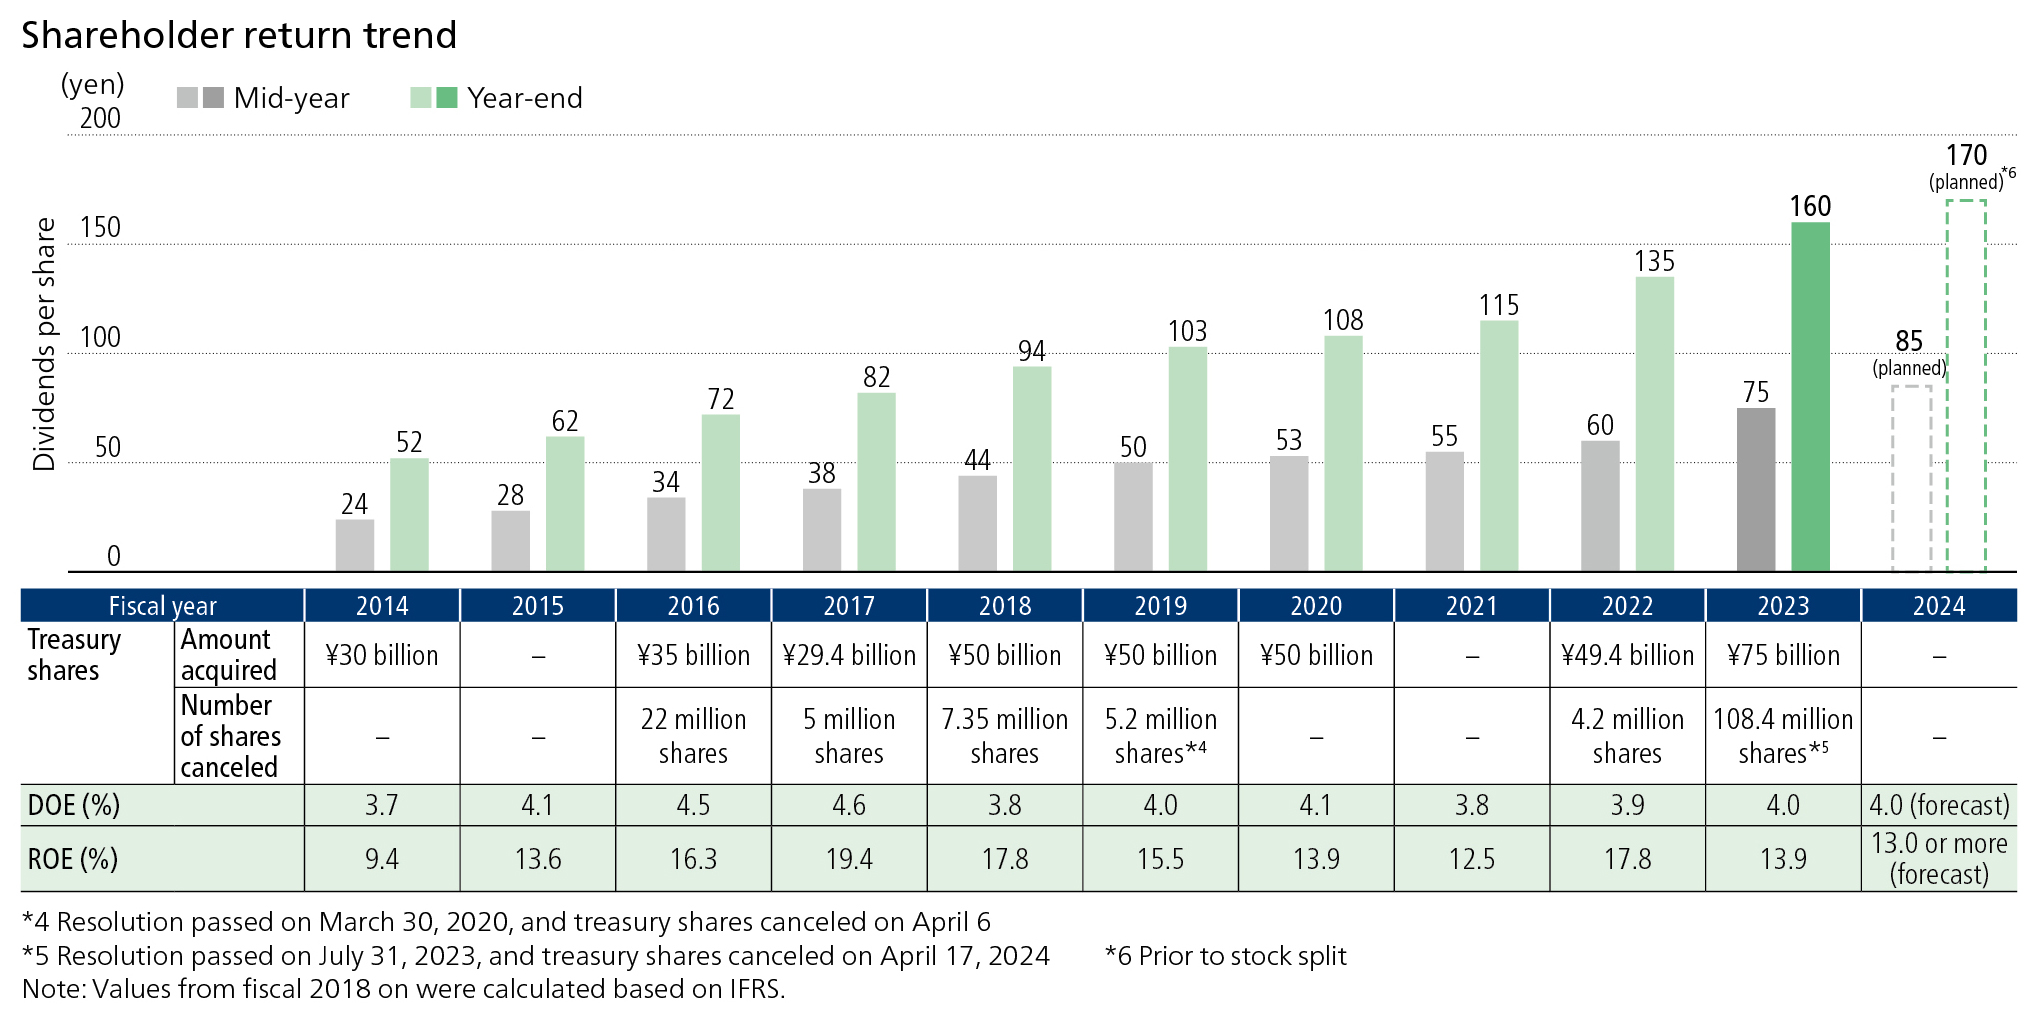
* Dividend on Equity attributable to owners of the parent: Profit attributable to owners of the parent ÷ (Liabilities + Equity + Accumulated Other Comprehensive Income) × 100 (%)
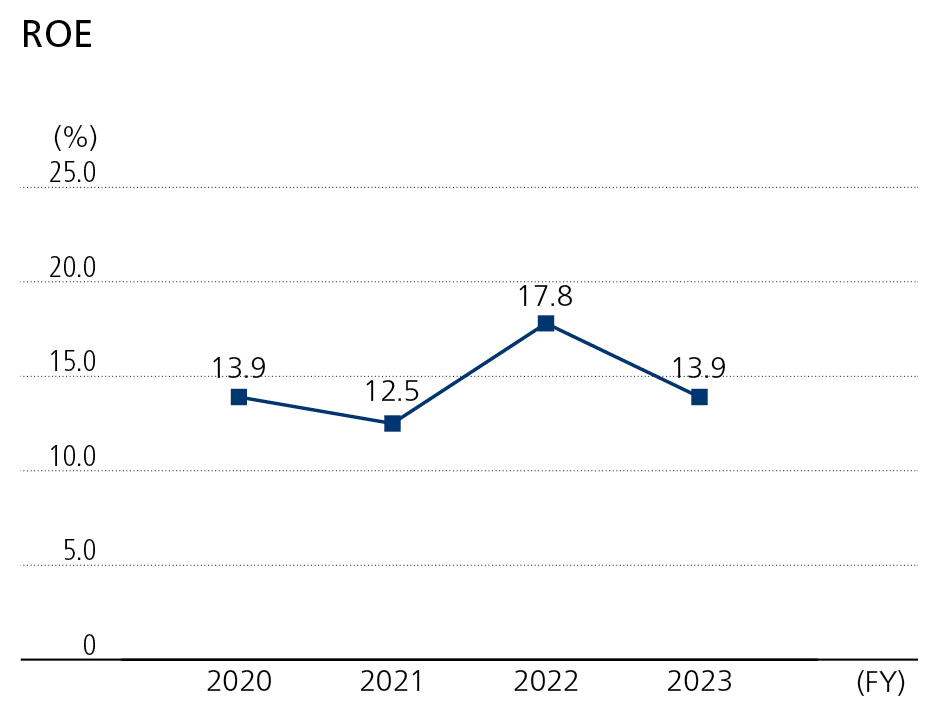
* Return on equity: Profit attributable to owners of parent ÷ (Shareholders’ equity + accumulated other comprehensive income) × 100 (%)
Notes:
- 1. From the fiscal year ended March 31, 2015, the Company has adopted a new accounting standard for research and development expenses (business research expenses). This change has been reflected in figures for the fiscal year ended March 31, 2014.
- 2In the fiscal year ended March 31, 2019, the Company changed the presentation method for tax effect accounting. The change has been reflected in figures for the fiscal year ended March 31, 2015, and subsequent periods.
- 3International Financial Reporting Standards (IFRS): Accounting standards defined by the non-government organization International Accounting Standards Board (IASB) headquartered in London.
- 4IFRS adopted from the fiscal year ended March 31, 2020